SpaceX vs. Meta: Two American Giants, Two Very Different Paths to Corporate Power
A comparison of Elon Musk’s space and connectivity business with Mark Zuckerberg’s social-media and technology empire—and what their revenue, market value, and business models really tell us.

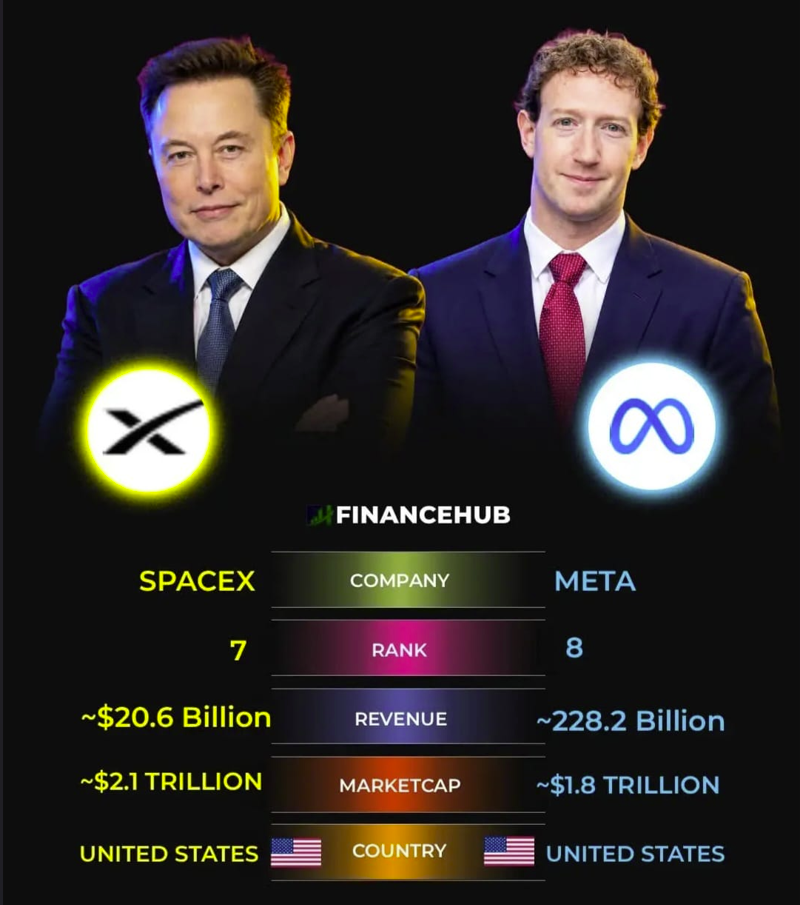
Two of the most recognizable figures in modern technology represent very different visions of the future. Elon Musk is associated with rockets, satellite internet, and ambitions to make humanity a multiplanetary species. Mark Zuckerberg built Meta around social networks and digital communication, and the company is now investing heavily in artificial intelligence, immersive technology, and new computing platforms. A comparison graphic circulating online places SpaceX and Meta side by side, listing revenue, market capitalization, and global rankings. The numbers make for a striking image, but the deeper story is about how different businesses create value—and why financial figures need context.
Two companies built around different ideas
SpaceX began with a mission to reduce the cost of reaching space and make launches more frequent. Its business includes launching satellites and cargo, carrying astronauts, and operating Starlink, a satellite-based broadband network. Starlink gives SpaceX a recurring-revenue business alongside launch contracts: customers pay for internet access, while governments, airlines, maritime operators, and other organizations can require specialized connectivity. This mix links space engineering with a service used on Earth.
Meta, by contrast, operates a large family of digital platforms, including Facebook, Instagram, WhatsApp, and Messenger. Advertising remains central to its business model. Businesses pay to reach audiences, and Meta uses its large user base, ad-targeting systems, and measurement tools to help advertisers find customers. The company is also spending on artificial intelligence, data centers, smart glasses, and virtual- and augmented-reality technologies. These investments may create new sources of growth, but they also require substantial capital and do not all produce returns at the same pace.
Revenue: the scale behind the headline
The graphic lists SpaceX revenue at approximately $20.6 billion and Meta revenue at about $228.2 billion. Such figures should be treated as a snapshot from the graphic’s stated date and source, not as permanent facts. Revenue is the money a company earns from its operations before expenses; it is not the same as profit, cash flow, or market value. Reporting periods also matter. A full-year figure, a trailing-twelve-month estimate, and an annualized quarterly result can differ substantially.
Meta’s published 2025 results reported full-year revenue of about $201.0 billion. In its third-quarter 2026 release, the company reported revenue of $64.6 billion for that quarter, up 26% year over year. That quarterly figure shows why older annual estimates can quickly become outdated. Meta’s advertising engine benefits from scale: more user activity and improved ad performance can attract advertisers, while AI tools can help personalize recommendations and optimize campaigns. Still, the company must balance revenue growth against infrastructure costs, regulation, privacy concerns, and the expense of developing new products.
SpaceX’s revenue profile has also been changing. Its established launch business operates alongside Starlink’s connectivity services, while newer technology and infrastructure activities may affect reported totals. The company’s third-quarter 2026 filing reported revenue of approximately $14.6 billion for the quarter. That is a quarterly figure, so it should not be directly compared with a full-year number without adjusting the periods. The important point is that SpaceX is no longer only a rocket-launch provider: recurring connectivity and newer technology businesses can change both its scale and the way investors evaluate it.
Market capitalization is not revenue
The image gives SpaceX a market capitalization of roughly $2.1 trillion and Meta approximately $1.8 trillion. Market capitalization is calculated by multiplying a company’s share price by its outstanding shares. It reflects what public-market investors collectively value the company’s equity at a particular moment. It does not represent the amount of money the company has in the bank, the value of its yearly sales, or a guaranteed price at which the entire business could be sold.
These figures can change daily as share prices move. They may also depend on whether the source uses real-time prices, a particular closing date, diluted share counts, or estimates. In addition, valuation comparisons are meaningful only when the underlying companies and securities are defined consistently. Readers should check the date and methodology before repeating a market-cap figure as definitive.
Investors often value a company based not only on what it earns today but also on what they believe it could earn in the future. A company expected to grow quickly may receive a higher valuation relative to current revenue than a mature company with slower expected growth. That can create impressive market values, but it also introduces risk: if growth disappoints, costs rise, or investor expectations change, the valuation can fall sharply.
Why SpaceX attracts a different kind of investor attention
SpaceX operates in industries with high technical barriers. Building launch vehicles, landing and reusing boosters, maintaining satellite networks, and expanding broadband coverage require engineering expertise, infrastructure, capital, and years of testing. A successful launch system can win contracts because reliability matters, while a broad satellite network can become more useful as coverage and capacity improve. These characteristics may create competitive advantages that are difficult for new entrants to reproduce quickly.
However, space remains a demanding business. Rockets can fail, development programs can run over budget, launches can be delayed, and regulatory approvals are essential. Satellite networks also require continued investment in spacecraft, ground equipment, spectrum coordination, and replacement capacity. Starlink must compete with other internet providers and respond to local rules in the markets where it operates. Ambitious future projects may offer substantial upside, but they should not be confused with guaranteed revenue.
Meta’s strengths—and its expensive bets
Meta’s most important advantage is the scale of its audience and advertising infrastructure. Its apps are deeply integrated into how people communicate, share content, discover products, and interact with businesses. Advertisers value the ability to reach large groups and measure campaign performance. AI can strengthen this model by improving recommendations, ranking content, and matching advertisements with likely customers.
At the same time, Meta faces a different set of risks. Changes in privacy rules or operating-system policies can affect ad targeting. Governments around the world scrutinize competition, content moderation, data protection, and the impact of social media on young people. The company also spends heavily on computing infrastructure and research. Investments in smart glasses, virtual reality, and AI may help shape future markets, but there is no certainty that every project will become a profitable business.
What does the ranking in the graphic mean?
The graphic assigns SpaceX a rank of 7 and Meta a rank of 8. Rankings are only useful when the ranking system is clearly defined. A company can be ranked by market capitalization, revenue, profit, brand value, or another measure, and each list can produce a different order. The image appears to compare company size using a particular market-data source, but readers should verify the ranking criteria and date before interpreting the numbers as a universal league table.
Rankings also tell only part of the story. A business with lower revenue can still command a high valuation if investors expect faster future growth. Another business may generate far more sales but face higher operating costs or slower growth. The best comparison therefore considers several measures together: revenue growth, operating profit, free cash flow, debt, capital expenditure, competitive position, and the uncertainty surrounding future plans.
How to read the comparison responsibly
There are three useful questions to ask whenever a graphic compares major companies. First, what period does each revenue figure cover? Second, is market capitalization measured on the same date and calculated using a consistent method? Third, does the image distinguish reported financial results from estimates or forecasts? If the answers are missing, the graphic can still introduce an interesting topic, but it should not be treated as a complete financial analysis.
It is also important to distinguish a company’s performance from the public profile of its founder. Musk and Zuckerberg attract attention because their decisions can influence large industries, but investors ultimately need to evaluate the businesses themselves. Leadership, innovation, and long-term vision matter; so do execution, financial discipline, governance, and the ability to turn expensive research into products customers will pay for.
What comes next?
SpaceX’s future will depend on how effectively it expands reliable launch services, grows Starlink, manages infrastructure costs, and turns ambitious technology programs into sustainable operations. Meta’s outlook will depend on the resilience of its advertising business, the usefulness of its AI systems, and whether major investments create durable new revenue streams. Both companies are investing in technology that could reshape important markets, but each faces different technical, commercial, regulatory, and financial challenges.
For readers, the most valuable takeaway is not simply which company appears higher on a ranking. SpaceX and Meta illustrate two routes to technological influence: building physical infrastructure that connects Earth and space, and building digital platforms that connect people, businesses, and information. Their revenue figures reveal the scale of their operations, while their valuations reveal investors’ expectations. Neither measure alone can tell us which company will perform better in the future.
Conclusion
The comparison between SpaceX and Meta is compelling because it brings together two ambitious American technology companies with very different foundations. Meta has a vast advertising-supported platform business and is directing resources toward AI and new devices. SpaceX combines launch services with satellite connectivity and other developing technologies. The graphic’s figures offer a starting point, but dates, reporting periods, ranking definitions, and market-price changes all matter. Anyone sharing or using the comparison should verify the latest financial disclosures and treat valuation numbers as time-sensitive estimates rather than fixed facts.
Sources and further reading: Meta’s official third-quarter 2026 results and annual financial disclosures; SpaceX’s third-quarter 2026 filing. Consult the latest filings for updated figures before making investment decisions.
- Meta: Third-Quarter 2026 Results
- SpaceX: Third-Quarter 2026 Filing (SEC)
- Meta: 2025 Annual Financial Statements (SEC)
Editorial note: This article is for general information and is not investment advice. Company valuations fluctuate, and financial comparisons should be checked against current disclosures.
Aviso legal: El contenido de historiadr.com es únicamente informativo y educacional. No sustituye el consejo, diagnóstico ni tratamiento médico profesional.